Highlights

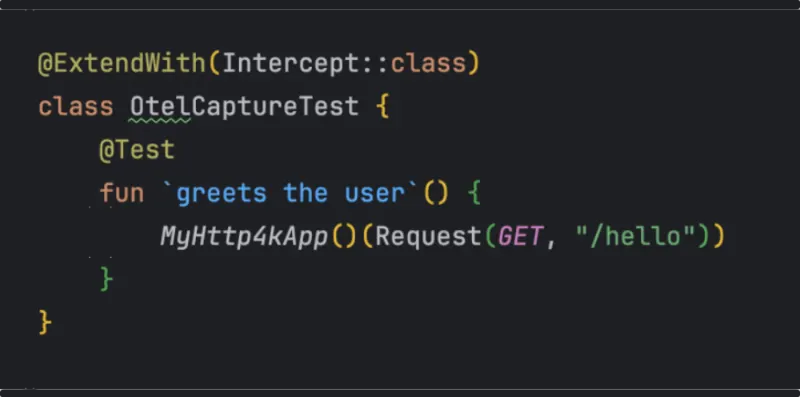
Intercept:
ZeroConfig
One annotation. OpenTelemetry traces, span events, structured logs, and baggage automatically captured and visualised in rich HTML reports on test failure. No collector, no dashboard, no infrastructure. Just add the annotation and run your tests.

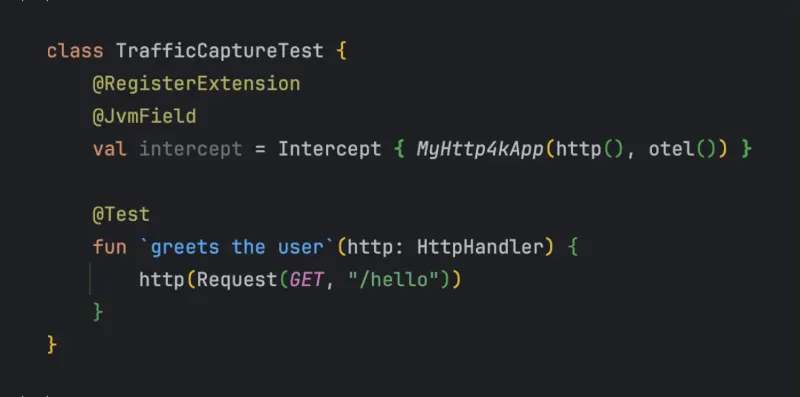
Intercept:
InMemory
@RegisterExtension for instrumented HTTP clients, traffic capture, Chaos Engine, and trace analysis - sequence, topology, timing, errors, and critical path. All in-process, no ports, full speed.

Intercept:
Reports
Self-contained HTML with Gantt timelines, sequence diagrams, interaction topology, timing, error and critical path analysis, HTTP transaction detail, and captured stdout/stderr. Export to markdown for living documentation.

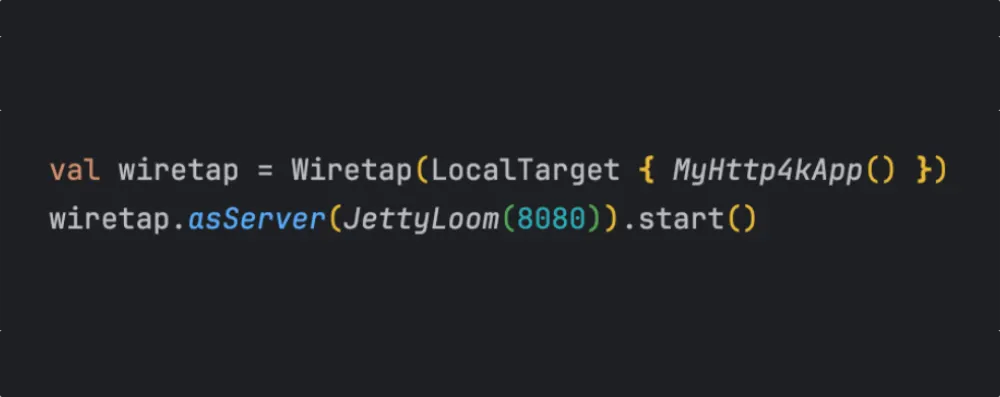
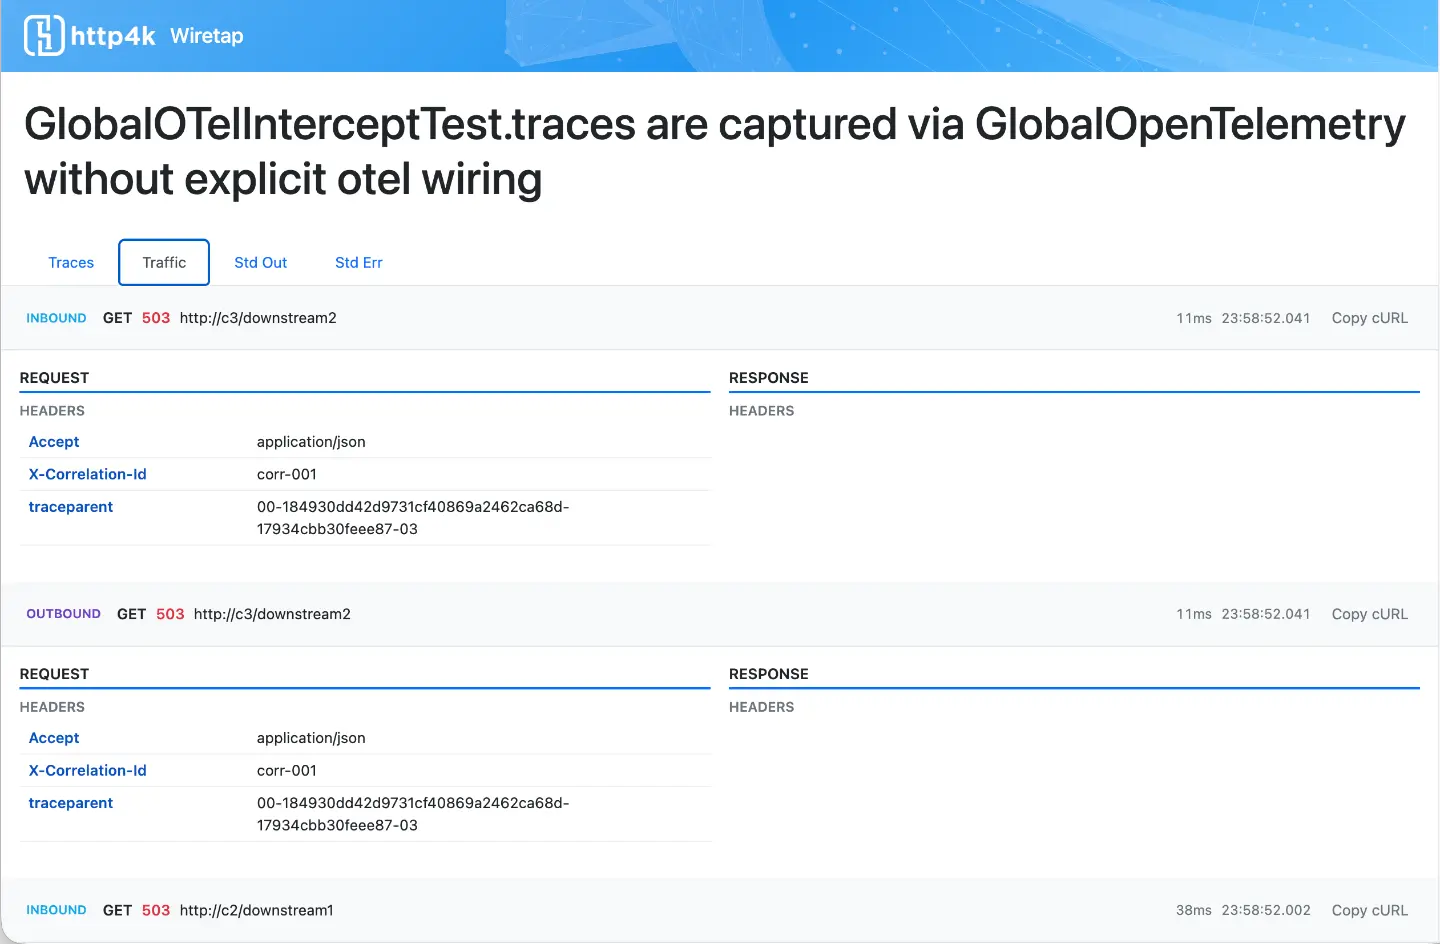
Wiretap:
TrafficMonitor
Real-time HTTP traffic capture with filtering, named views, and request replay. See every request and response flowing through your app. Inspect headers, bodies, and timing. Export transactions as HAR files.
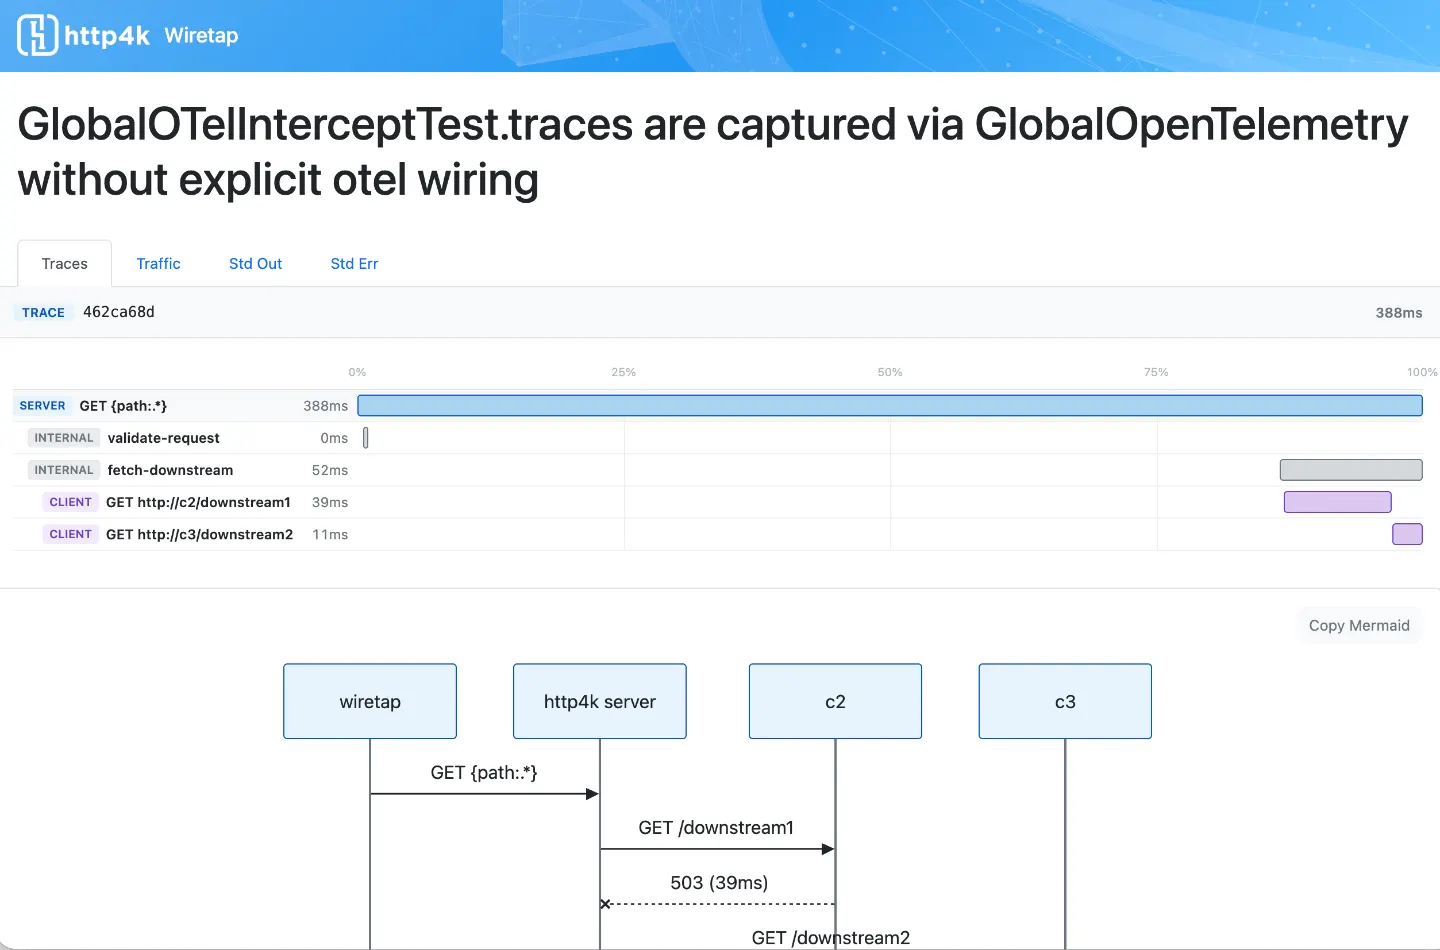
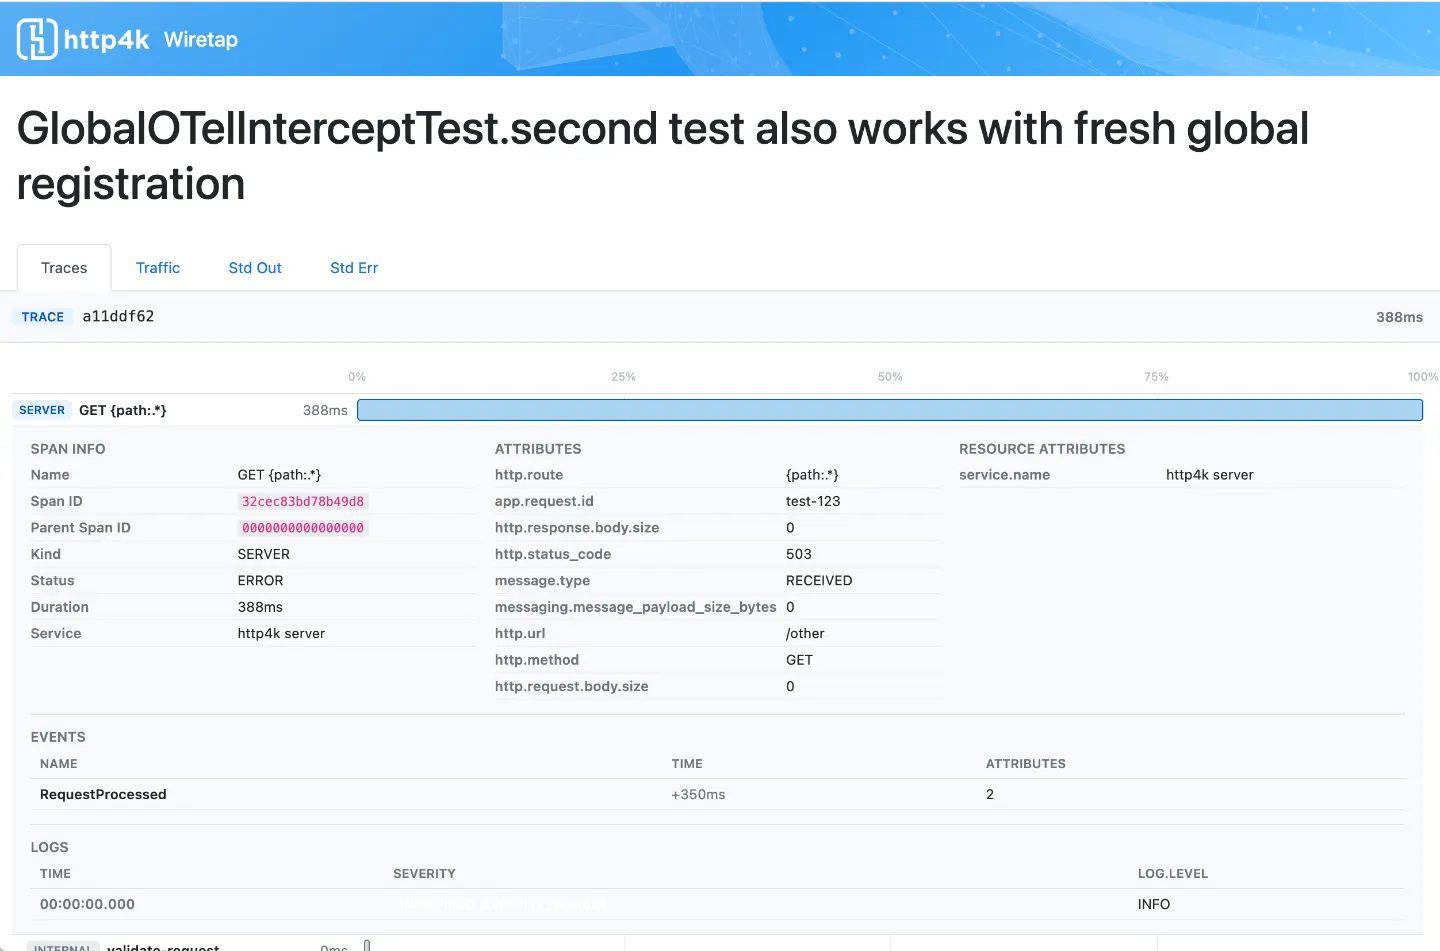
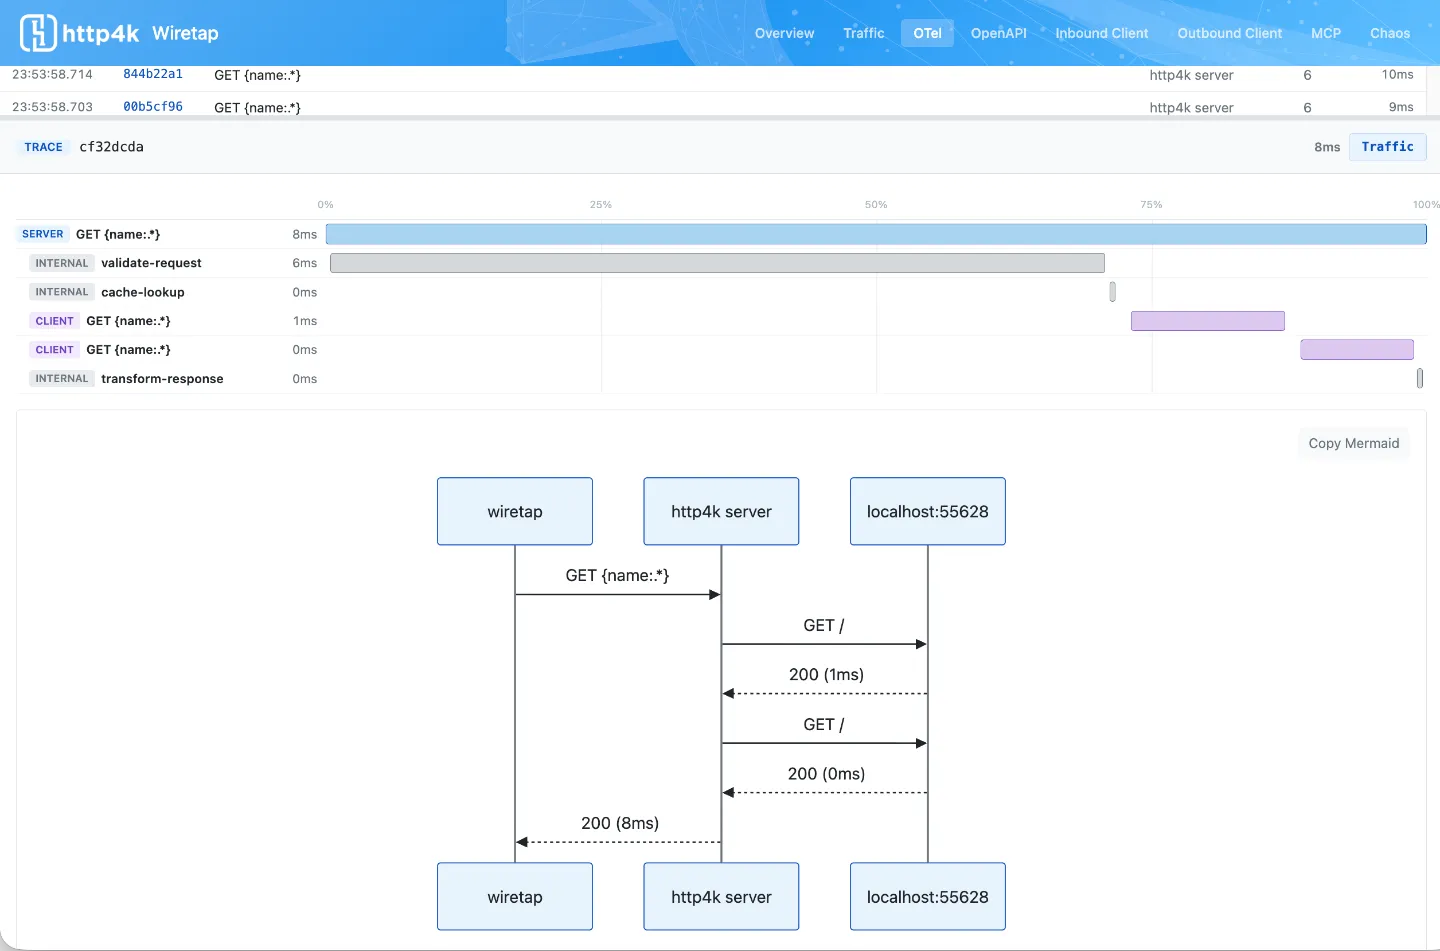
Wiretap:
OpenTelemetry
Gantt chart trace visualisation with sequence, interaction topology, timing, error isolation, and critical path diagrams. MCP-aware span naming per OTel conventions. Export as markdown.
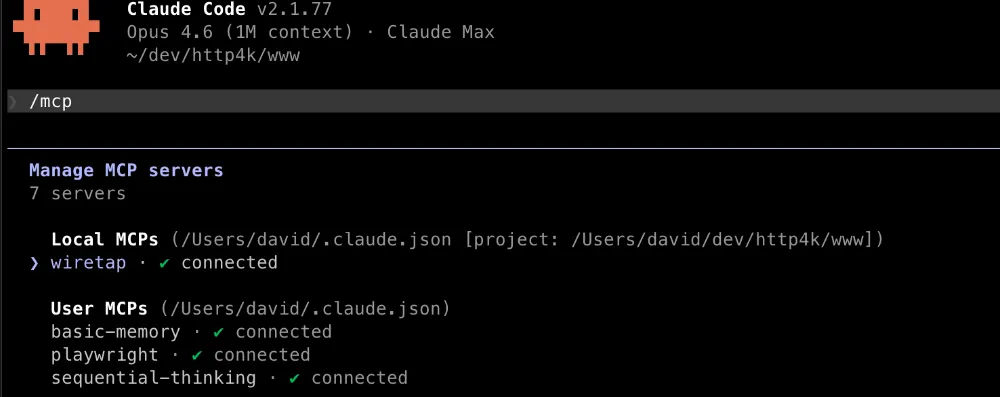
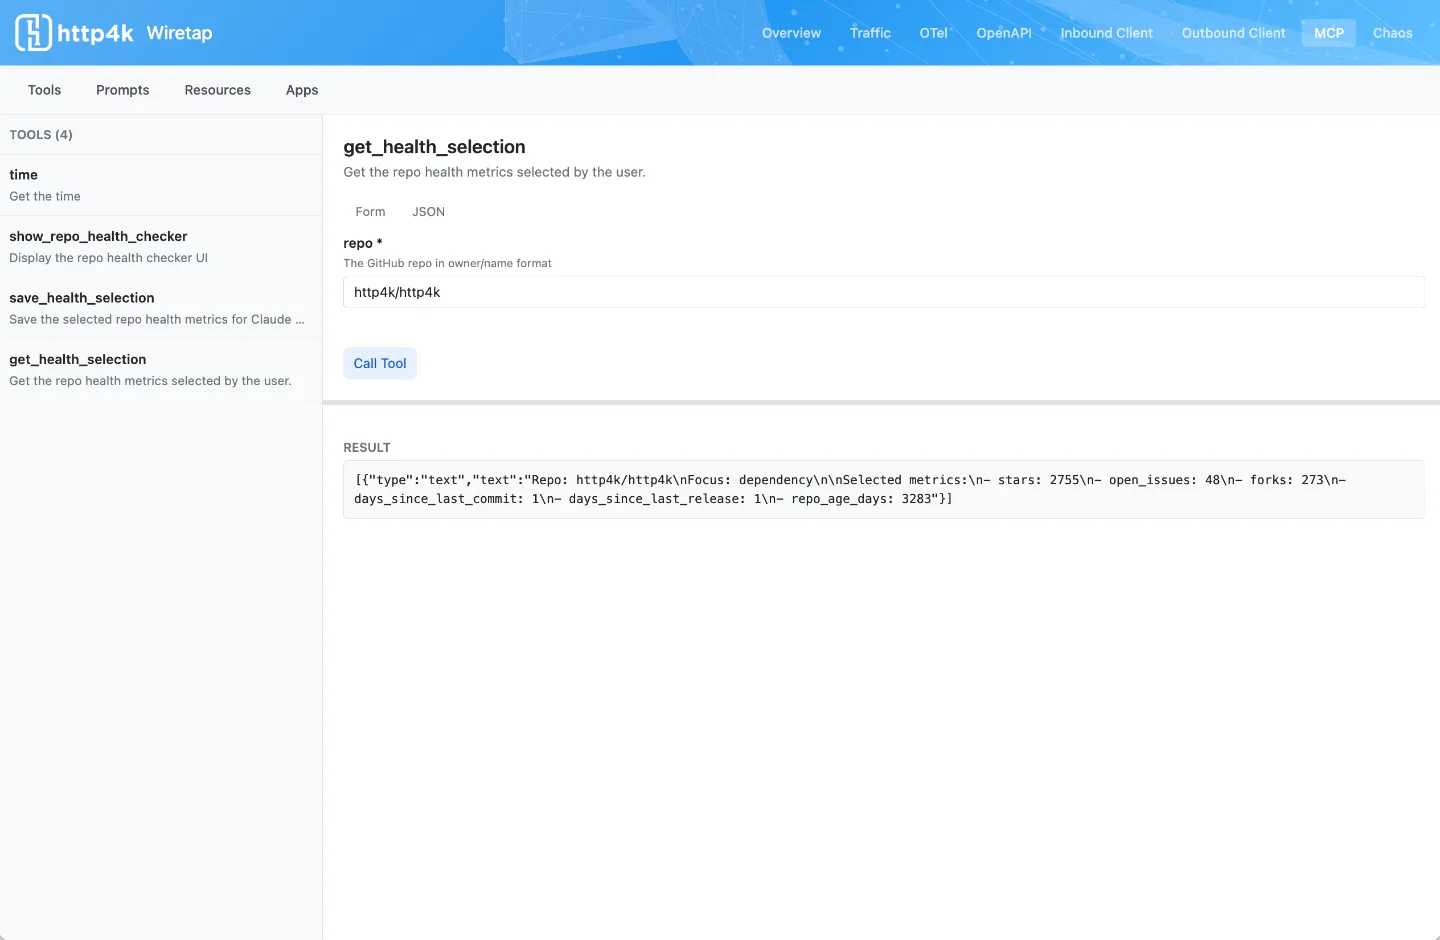
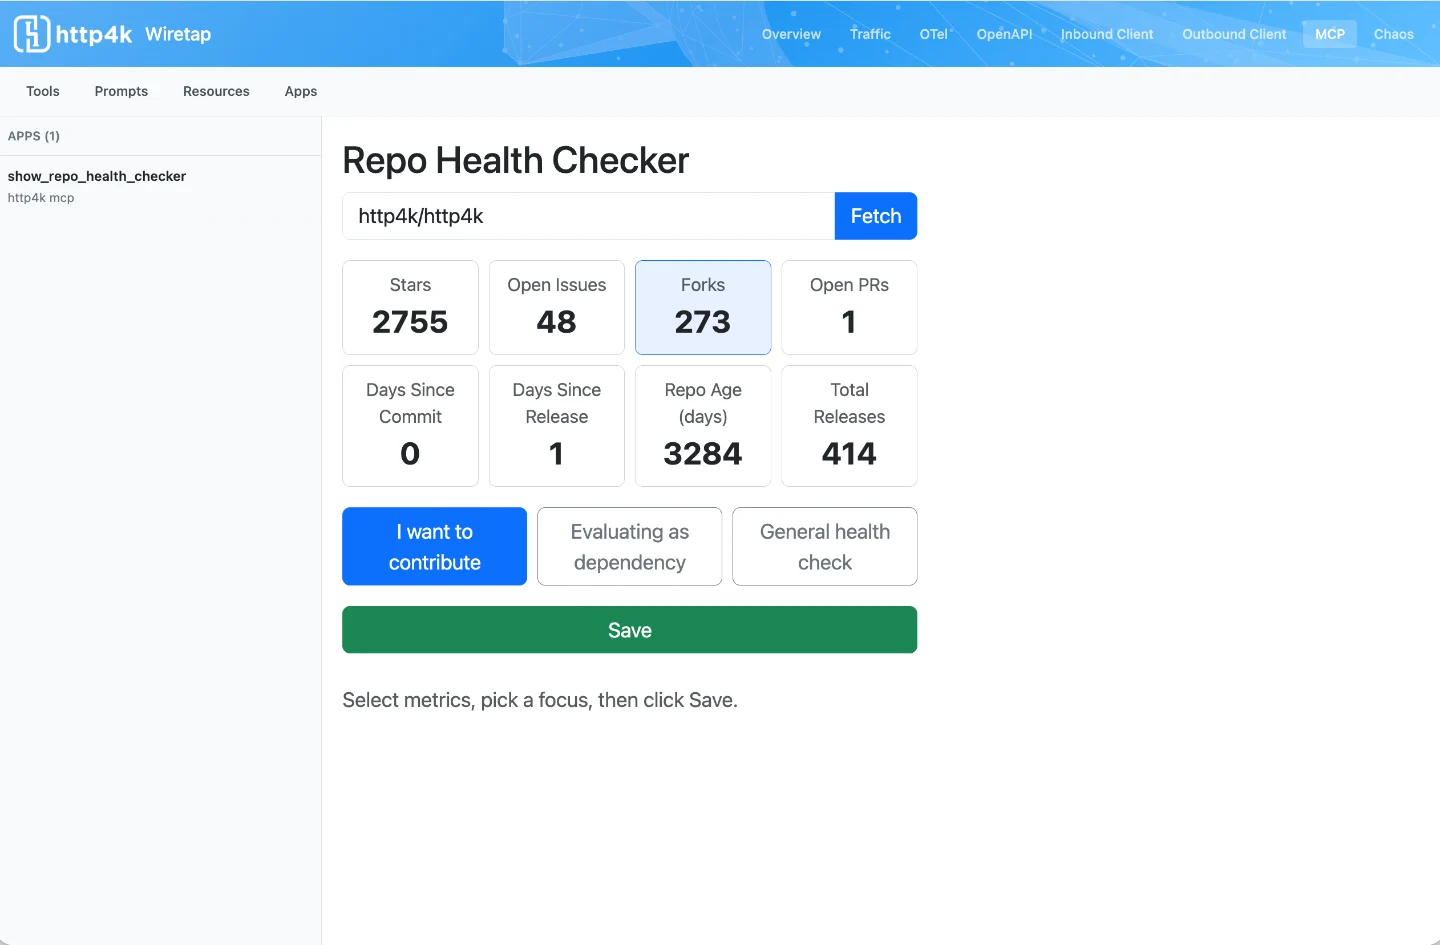
Wiretap:
MCPPanel
A pure Kotlin MCP Inspector replacement built into your app. Browse and invoke tools, prompts, and resources. Host and render MCP Apps with interactive UI. Plus every Wiretap feature exposed as MCP tools for AI-assisted debugging.
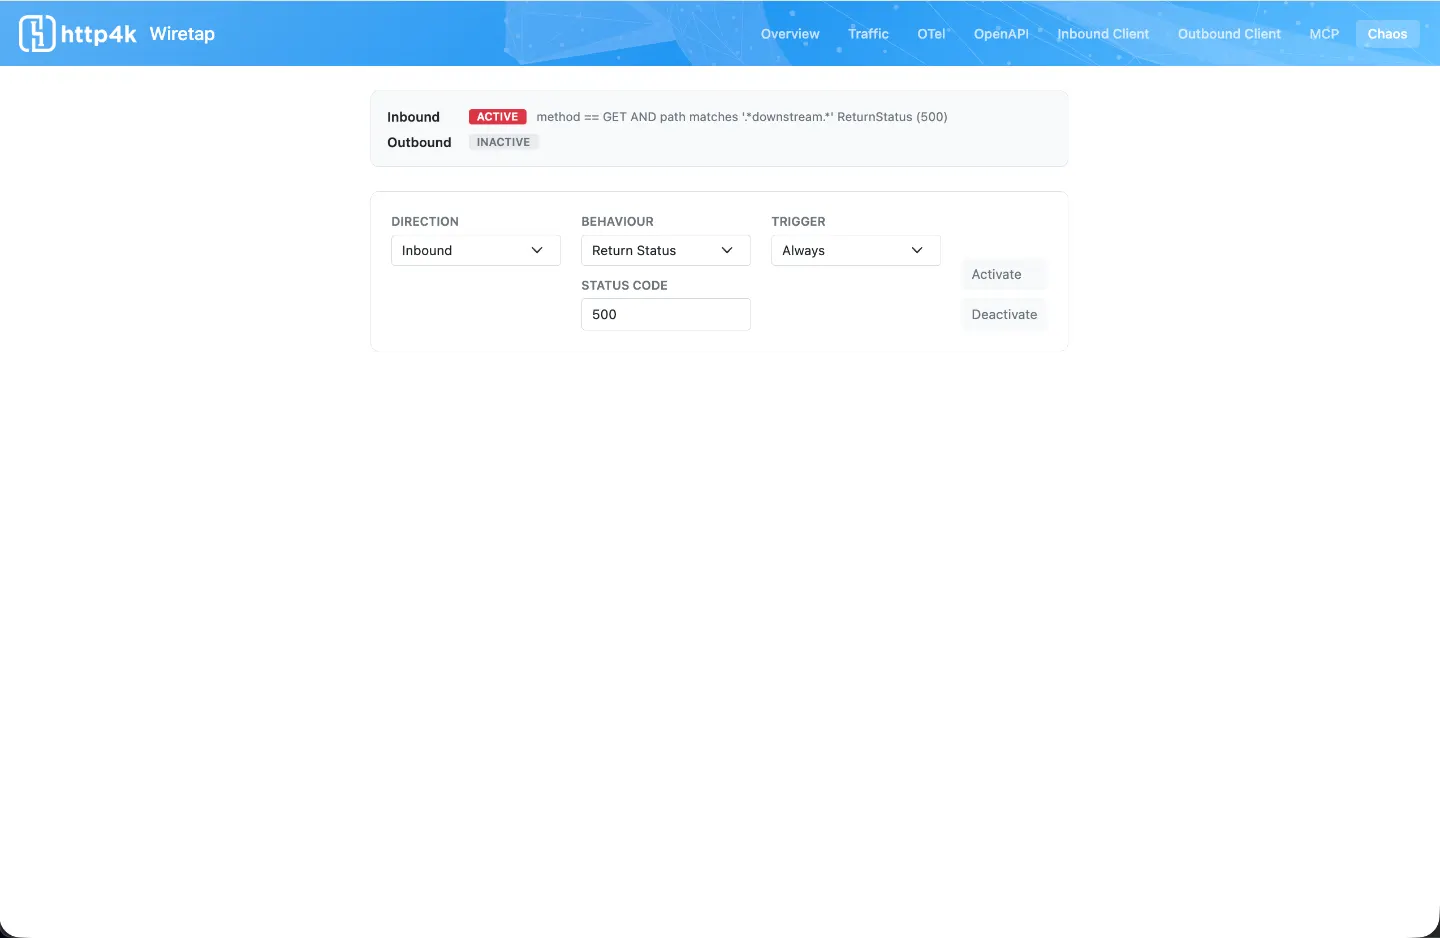
Wiretap:
ChaosEngine
Inject failures, latency, and error responses into inbound and outbound traffic. Test resilience without changing code. Toggle chaos on and off at runtime from the UI or via MCP tools.
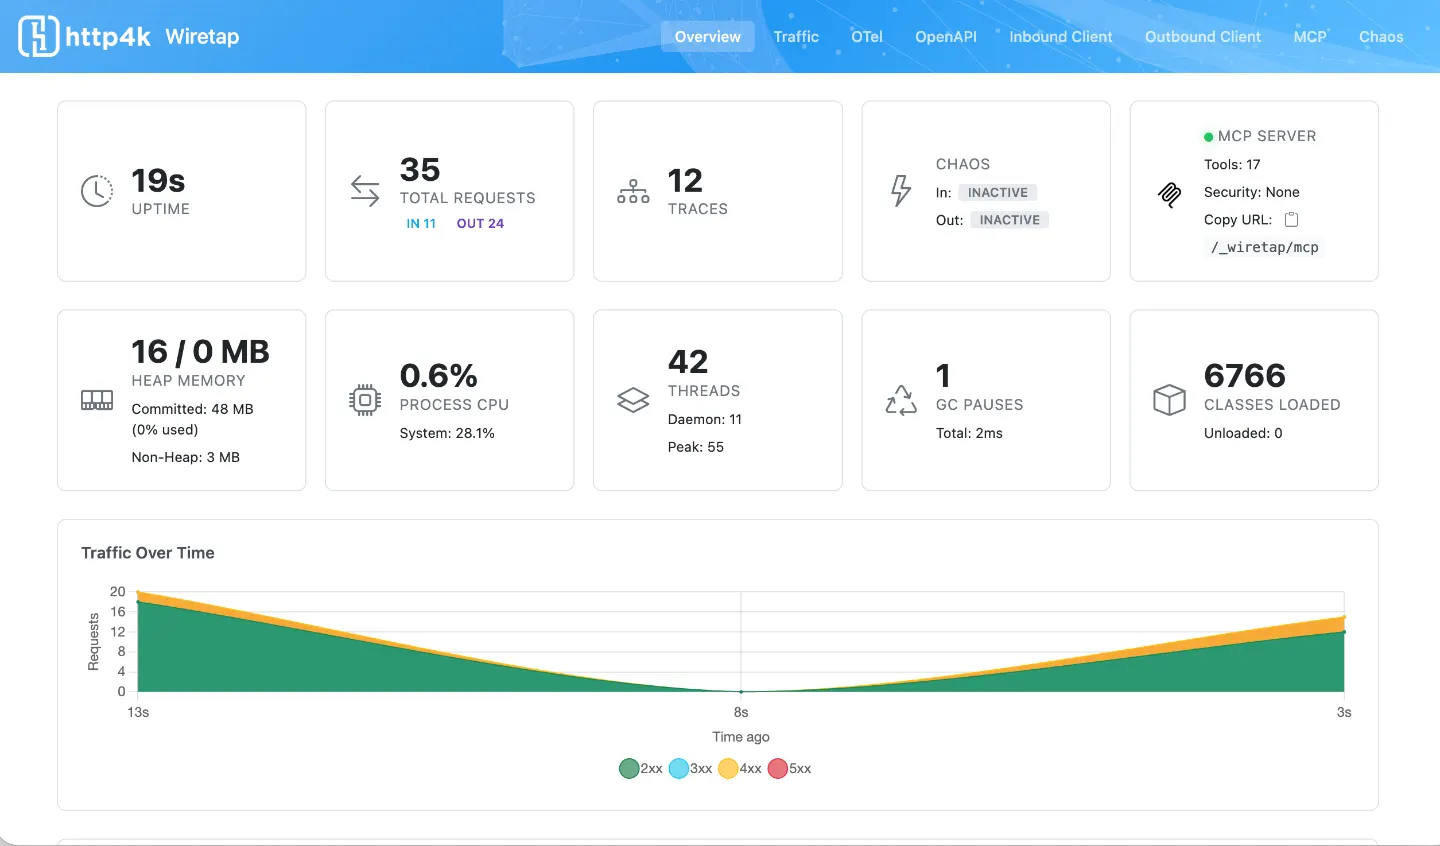
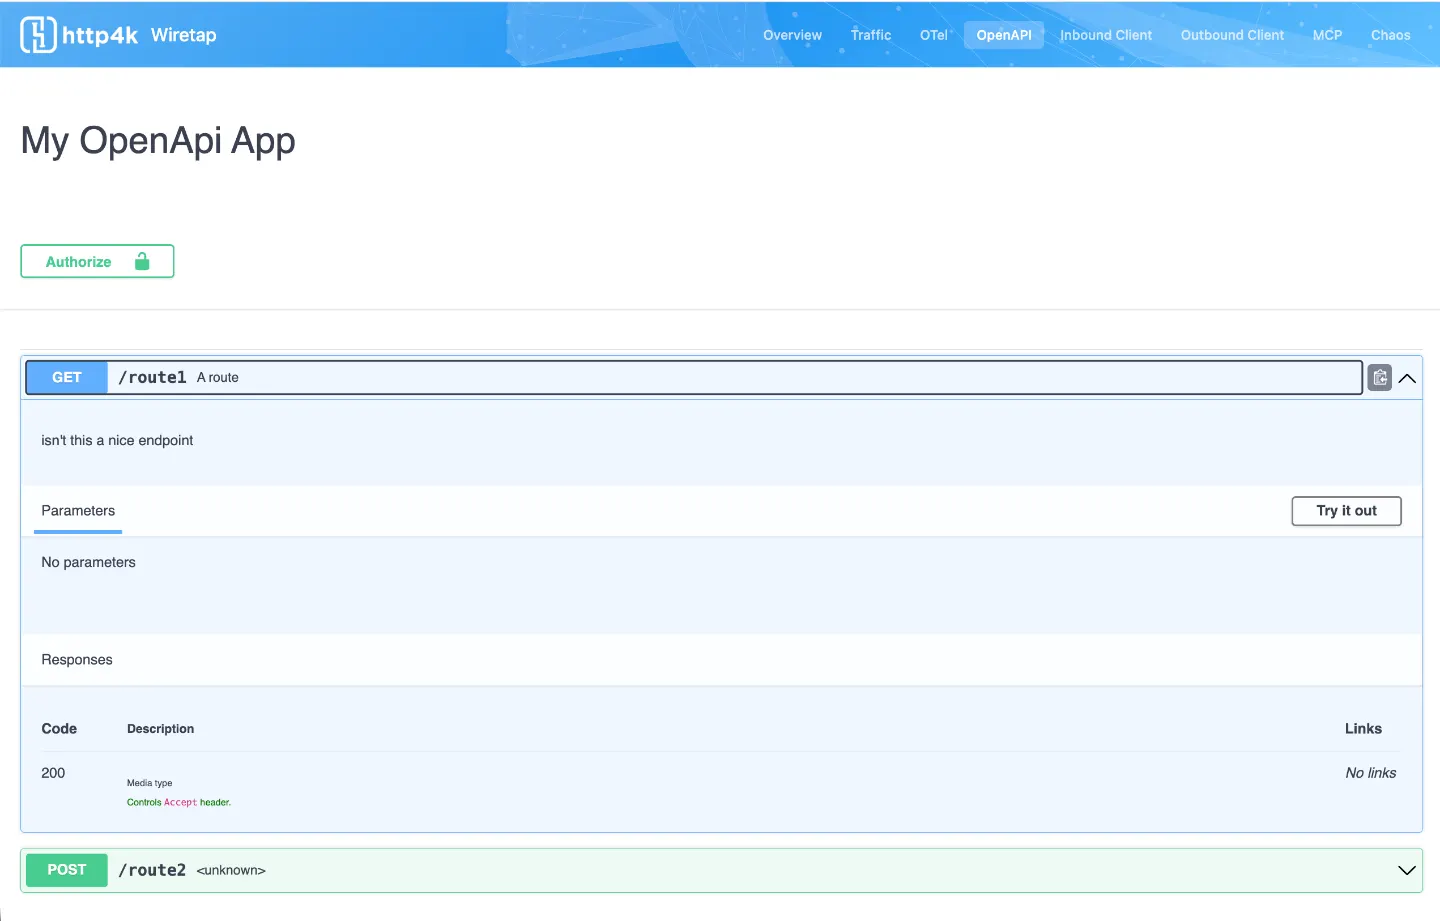
Wiretap:
Dashboard & OpenAPI
Home dashboard with live stats, latency distribution, traffic timeline charts, and JVM metrics. Built-in HTTP client for ad-hoc requests and embedded Swagger UI for your OpenAPI spec.